Biomed Res Bull. 2(2):49-55.
doi: 10.34172/biomedrb.2024.08
Original Article
Identifying Methamphetamine Users Through Electroencephalography Analysis: Harnessing Highly Comparative Time-Series Analysis and Machine Learning Approaches
Reza Meynaghizadeh-Zargar 1  , Sareh Kazmi 1, 2, Saeed Sadigh-Eteghad 1, Abdollah Barati 3, Ali Reza Shafiee-Kandjani 3, 4, *
Author information:
1Neurosciences Research Center, Tabriz University of Medical Sciences, Tabriz, Iran
2Department of Neuroscience, Faculty of Advanced Medical Sciecne, Tabriz University of Medical Sciences, Tabriz, Iran
3Research Center of Psychiatry and Behavioral Sciences, Tabriz University of Medical Sciences, Tabriz, Iran
4Department of Psychiatry, Faculty of Medicine, Tabriz University of Medical Sciences, Tabriz, Iran
Abstract
Background:
Methamphetamine is a chemical substance which affects the brain electrical activity of addicted individuals. The study aimed to assess the potential of using electroencephalography (EEG) signals and machine learning (ML) techniques to distinguish individuals with methamphetamine (MA) dependence from healthy individuals.
Methods:
The researchers utilized highly comparative time-series analysis (hctsa) for feature extraction. Three ML algorithms, logistic regression (LR), support vector machine (SVM), and random forest (RF), were employed to process the data. Various combinations of top 40 features were used to test the possibility of reaching 100% accuracy.
Results:
Although individual features did not achieve 100% accuracy, combinations of two features resulted in two distinct states with a prediction accuracy of 100% when using the SVM approach. Even more combinations of features with 100% accuracy were found when utilizing more features.
Conclusion:
Based on the findings, SVM, LR, and RF classifiers, combined with feature extraction through the hctsa method, demonstrated exceptional accuracy in identifying MA users among healthy individuals using a single EEG channel. The classification accuracy reached up to 100%.
Keywords: Electroencephalography, Methamphetamine, Machine learning, Hctsa
Copyright and License Information
© 2024 The Author(s).
This is an open access article distributed under the terms of the Creative Commons Attribution License (
http://creativecommons.org/licenses/by/4.0/), which permits unrestricted use, distribution, and reproduction in any medium, provided the original work is properly cited.
Funding Statement
We utilized previously recorded data and conducted this study without any external funding.
Introduction
Methamphetamine (MA) is a widely abused substance that acts as a brain stimulant, emulating the physiological effects of monoamines such as dopamine. The activation of the brain’s reward system by MA, coupled with its affordability, primarily contributes to the intense cravings for MA. This can lead to dependence and addiction on a global scale1 and can be related to other psychiatric disorders.2,3 Methamphetamine-dependent individuals (MDIs) often suffer from various psychological issues, such as cognitive impairments and neurobehavioral disturbances, due to brain structural damage. This damage may include cortical loss, disruptions in normal cortical functions, and alterations in dopaminergic pathways connecting the limbic system, cingulate gray matter, putamen, caudate, and striatum nuclei.4 As a result of these pathological changes, chronic MA abuse can affect both neurotransmitter systems and neuro-electrical activity within the brain.5 Substance dependence disorders are characterized by their chronic, relapsing nature and long-term health consequences. They pose significant challenges to society by contributing to a wide range of issues such as illness, criminal activity, accidents, domestic violence, and homelessness, among others.6 Developing a reliable method to distinguish MDI from normal controls (NC) based on noninvasive techniques could serve as an invaluable tool.
Time series, generated by collecting sequential measurements of a specific variable over time, is a prevalent method across various scientific disciplines and industries. Types of time series analyzed range widely.7 The highly comparative time-series analysis (hctsa) software provides a systematic, algorithm-based platform that enables the calculation of numerous structural attributes from a single time series. These characteristics include fundamental distribution statistics, linear correlation configurations, stationarity, entropy, and information-theoretic metrics. The applied techniques are derived from the nonlinear time-series analysis domain in physics as well as linear and nonlinear model fitting, among others.7,8 Hctsa has recently garnered considerable attention in electroencephalography (EEG) signal processing for applications such as sleep staging 9, cognitive impairment detection 10, and visuomotor tracking state detection.11
Machine learning (ML) originates from the convergence of statistics-which aims to identify relationships within data- and computer science-which emphasizes effective computational algorithm development.12 The application of ML for automated analysis for medical purposes is gaining significant interest, particularly in clinical diagnostics that rely on EEG data.13 These techniques have been widely used in various fields of medicine, such as detecting depression severity,14 seizure detection,15,16 association between substance use and violence 17, and emotion recognition18,19 by EEG recordings or other types of medical data. This research seeks to examine three ML methods with the top 40 features extracted from hctsa to assess the differences between healthy individuals and those with MA dependence.
Methods
Sampling
The EEG recordings of MA users in abstinent periods and healthy individuals were utilized in this study.4 The selected MA users had an average duration of 5 years of MA use and a 7–9 day abstinent period. All males aged between 20 and 45 years. Participants were recruited from the Razi Mental Hospital in Tabriz, Iran, with patients and healthy individuals being selected from the inpatient and outpatient populations, respectively. The inclusion criteria for the study required patients to have a history of prolonged MA use, lasting at least one year, as well as a positive MA screening test within the past month. On the other hand, the exclusion criteria for participants consisted of a history of seizures, a positive history of neurological disorders, cognitive impairment, long-term or high-dose intake of sodium valproate, chlorpromazine, lamotrigine, benzodiazepines, or topiramate. The maximum permissible doses of these medications were 0.5 mg alprazolam, 25 mg chlorpromazine, 250 mg sodium valproate, 25 mg lamotrigine, 1 mg lorazepam, 25 mg topiramate, and 0.25 mg clonazepam. Furthermore, potential participants were excluded if they had a history of any mental illness or had tested positive for morphine within the last 90 days. The recordings of nine healthy and ten MDI were extracted after preprocessing the raw data.
Electroencephalography Recording
In this study, the EEG signals were acquired using a 19-channel silver-chloride (Ag/Cl) electrode array, in accordance with the conventional 10-20 system. The array was connected to an EEG amplifier (Mitsar, Russia) for signal enhancement. During the EEG recording process, a linked-ear reference was employed to maintain electrode impedance below 5 kΩ consistently. The acquired signals were sampled at a frequency of 500 Hz to ensure accurate data representation.
Both control and experimental groups participated in a 10-minute EEG recording session under resting conditions with eyes closed. This approach aimed to capture cerebral activity effectively and reliably. For participants with a history of MA use, the EEG recording session was conducted during their first week of admission, before administering increased dosages of psychiatric medications. This timing ensured that potential confounding factors were minimized and the recorded data accurately reflected their cerebral activity.
Preprocessing Electroencephalography Signal
EEG signals are typically susceptible to contamination from various sources. In this study, the EEGLAB toolbox (version 3.8) was employed to preprocess the EEG data before extracting features. The artifacts were automatically eliminated using artifact subspace reconstruction bad burst rejection, allowing for a maximum 0.5-second window standard deviation of 5 and a maximum of 5% out-of-bound channels.
High-frequency components within the EEG signal may be contaminated with muscle artifacts or eye movement interference. To address this issue, a low-pass finite impulse response filter with a cutoff frequency of 40 Hz was applied for artifact removal. Furthermore, low-frequency components of the EEG signal (below 0.5 Hz) could be influenced by head or body movements. A high-pass filter with a cutoff frequency of 1 Hz was implemented to minimize these artifacts. Additionally, a notch filter was utilized to eliminate the 50 Hz frequency component linked to power line noise since filters are not entirely ideal and may result in the leakage of adjacent frequency components.
Feature Extraction and Selection
In this study, feature extraction was performed by employing the hctsa software (version 1.08), which encompasses a comprehensive set of 1,080 master operations capable of extracting a total of 7752 distinct features. These features originate from various scientific disciplines, including neuroscience, seismology, physics, economics, and artificially generated simulated data.7,8 Notably, the extraction process can be executed using a single EEG channel within the hctsa framework. Our previous research demonstrated a significant difference in coherency between the Cz and C3 channels,4 prompting us to select the Cz channel for subsequent analysis in feature extraction using hctsa. Furthermore, this investigation employed a dataset consisting of 50,000 EEG samples for analysis within the hctsa software.
Classification Methods
Data normalization can substantially enhance the accuracy of specific ML models, and certain models may exhibit suboptimal performance in the absence of normalized data. In this study, the top 40 features extracted from the hctsa software were subjected to normalization prior to the classification analysis. The Min-Max Scaler was selected as the normalization technique for our research, as it effectively rescales the data to a range of [0, 1]. This process can be mathematically represented by the following equation:
X_normalized = (X – X_min) / (X_max – X_min)
To evaluate the proficiency of feature extraction through hctsa in classifying data, three ML methodologies were employed, including support vector machine (SVM), logistic regression (LR), and random forest (RF). The SVM is a versatile supervised classification algorithm that accommodates various kernel types, such as linear, polynomial, and radial basis function kernels.20 SVM has proven effective in high-dimensional spaces, especially when the number of dimensions exceeds the number of subjects. A linear support vector classifier, fine-tuned with a regularization parameter (C) set to 1, a tolerance threshold for stopping criteria of 1e-4, and a linear kernel were utilized in the present study. This configuration highlights SVM’s capability in handling complex high-dimensional data landscapes and facilitating robust and precise categorization between healthy individuals and MA-dependence patients.
LR provides insights into the relationship between predictor variables and binary outcomes by fitting a logistic or sigmoid function to the given data. This function maps predictor values onto a continuum between 0 and 1, representing the likelihood of event occurrence. As a classification algorithm, LR is widely used due to its straightforward implementation, ease of interpretation, and ability to accommodate both categorical and continuous predictor variables.21 In our study, the limited-memory Broyden-Fletcher-Goldfarb-Shanno method was employed as the optimization algorithm for LR. The model was augmented with an L2 regularization penalty, where the regularization parameter, C, was set to 1.0. The algorithm was set to cease iterations upon reaching a tolerance threshold of 1e-4, and the maximum number of iterations was capped at 100.
The RF classifier is an ensemble learning method that combines multiple decision tree (DT) classifiers. Each classifier is generated using a distinct random vector independently sampled from the input vector.22 Every individual tree contributes a unit vote toward the classification of an input vector, favoring the class with the highest frequency of votes. In our RF application, the ensemble was configured to consist of 100 individual DTs. The maximum depth parameter was left undefined, allowing nodes to expand without limitation until each leaf contained fewer samples than the specified minimum split threshold. Additionally, the minimum number of samples necessary for a leaf node was set to one.
Validation of Classification Models
The design of a classifier requires a comprehensive and impartial evaluation of its performance across a spectrum of features and classifier designs, with suitable coefficient values that correspond to a large cohort of subjects. To ensure a fair and robust evaluation, the K-fold cross-validation technique was employed, whereby the dataset was partitioned into 9 equal segments, each containing an equal number of study participants. In each iteration, 8 segments were used as the training subset, while the remaining segment was utilized as the test subset. This iterative process allows for an accurate assessment of the classifier’s performance and convergence in scenarios where data points are limited or when features are employed for both training and testing the model.
Results
Highly Comparative Time-Series Analysis Features
The results of analyzing data with hctsa indicated that 6070 features, out of the 7752, produced real values for all the subjects, and the remaining certain features produced special values (fatal errors or non-real values). In this study, the TS_Normalize function in hctsa was employed to eliminate the features that produced special values in over 21% of the time series for each dataset. On average, 1682 features were eliminated from each subject. The range of values generated by the remaining hctsa features varied across features. Nonetheless, the TS_Normalize function includes a normalization method to transform the extracted data into a range between 0 and 1. To better visualize similar features, the TS_Cluster function implemented inside the hctsa was used to reorder rows and columns of the extracted results. The results of clustered features are shown in Figure 1. This is a data matrix consisting of rows of different time series (EEG data for each individual) and columns of extracted features from hctsa that were normalized and reordered.
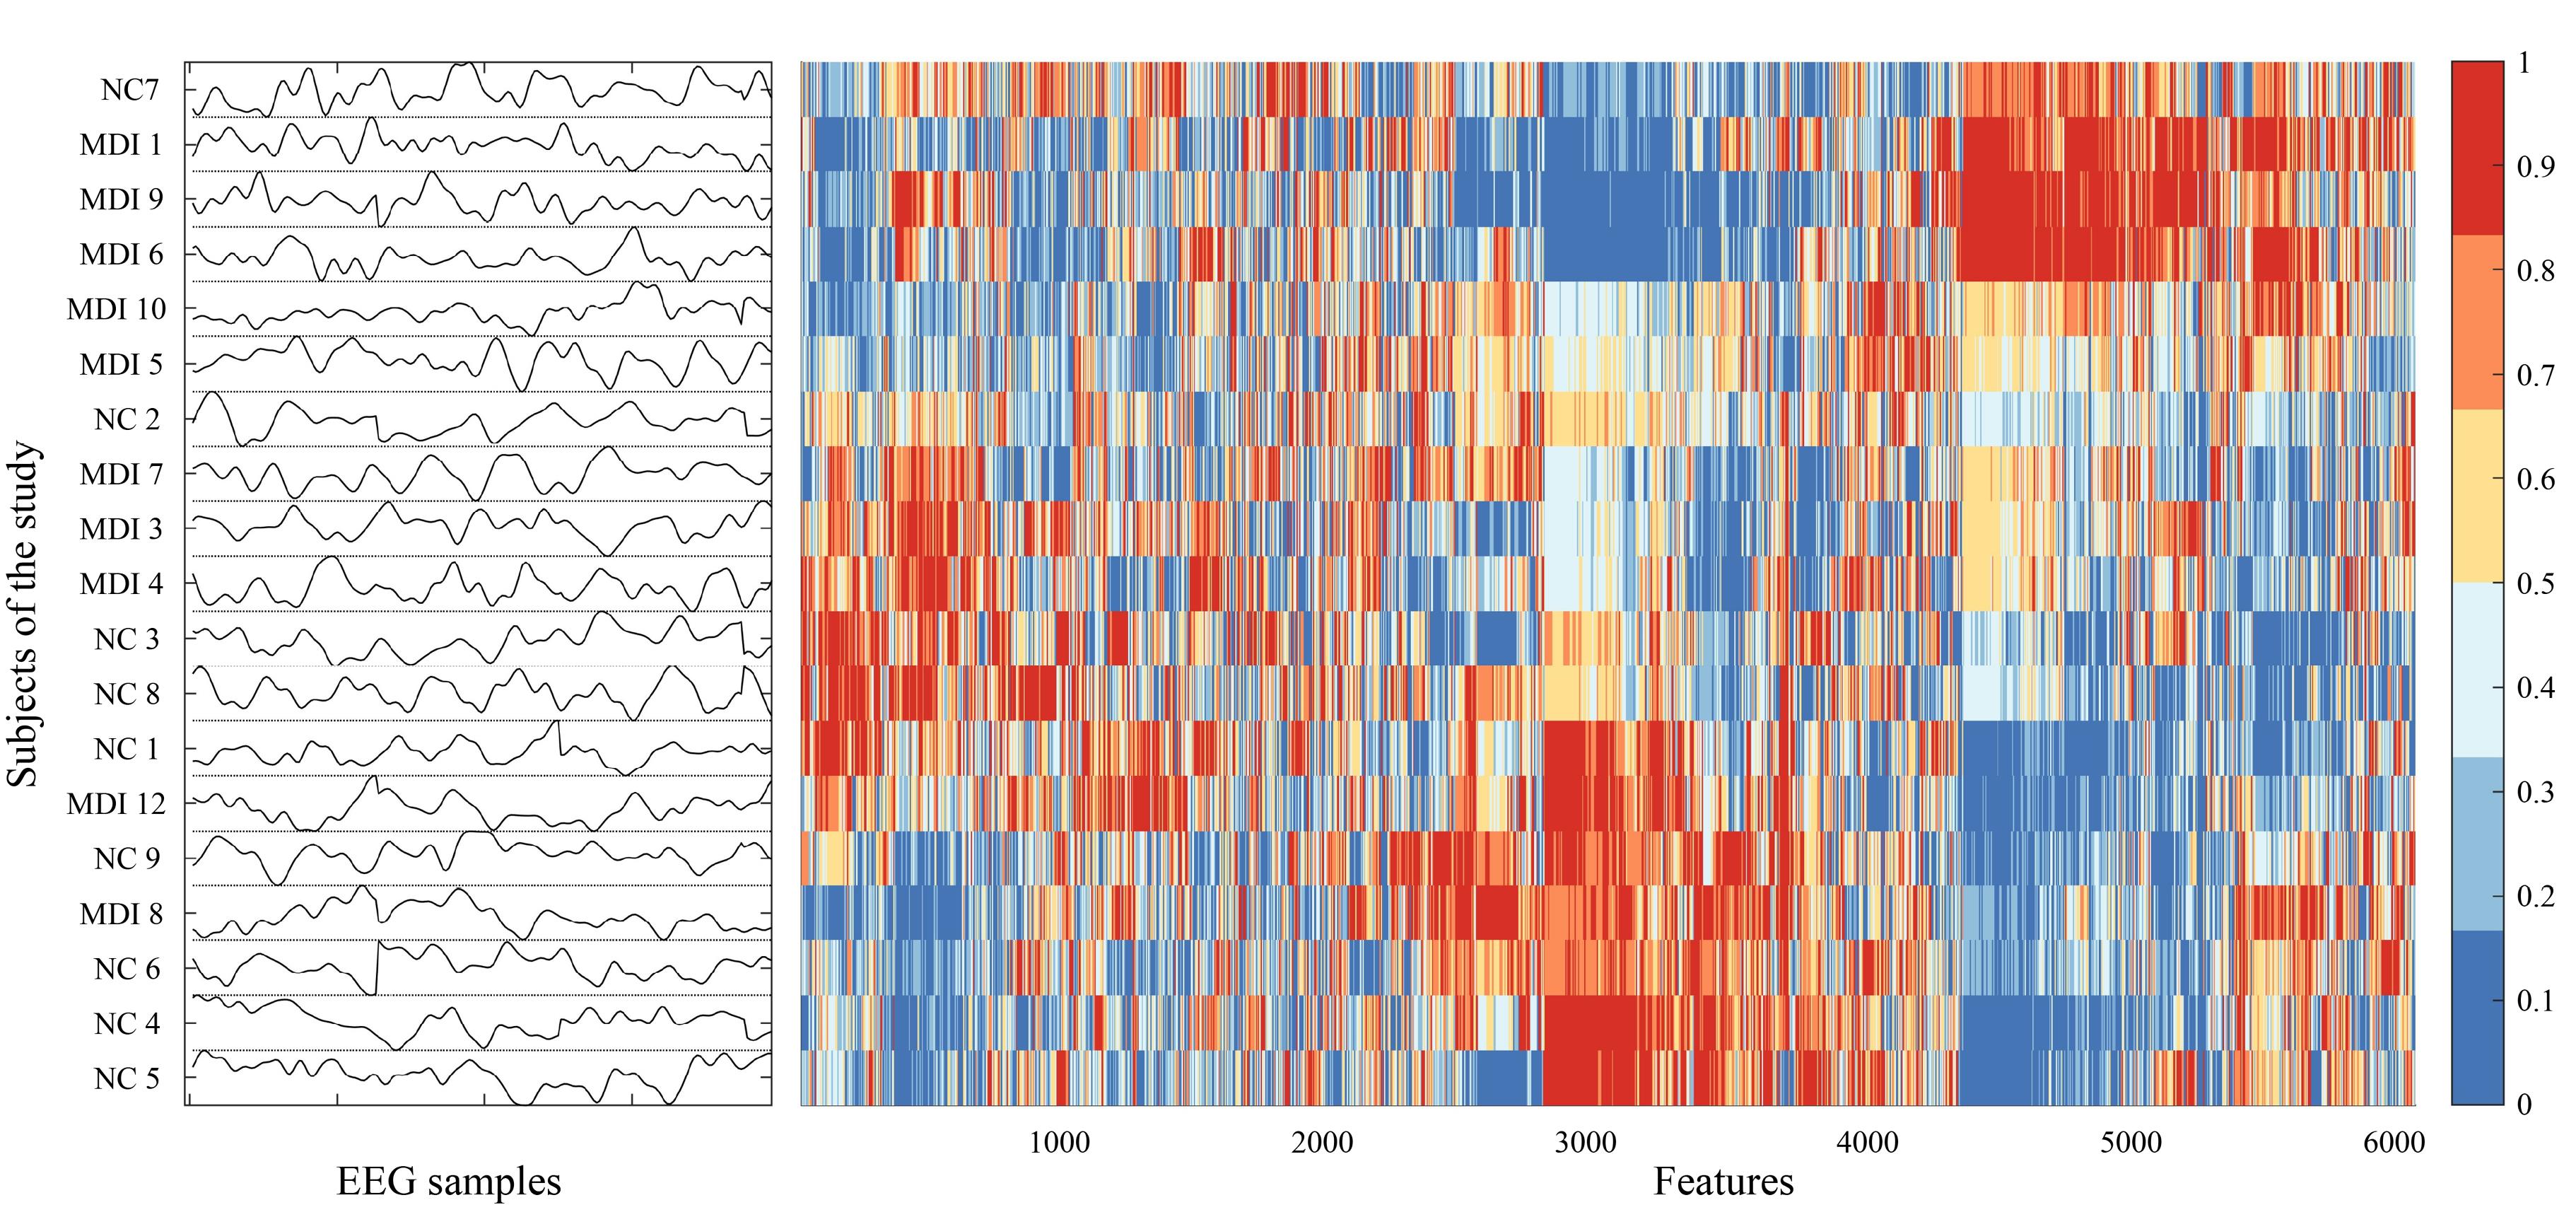
Figure 1.
Data Matrix of 19 Rows and 6,070 Columns Including Features Generated From 1,080 Master Operations With Hctsa. Note. Hctsa: Highly comparative time-series analysis. Each row represents the EEG data from the subjects of the study, and each column is a feature that was normalized and reordered for better visualization. NC: Normal Control; MDI: Methamphetamine dependence individual
.
Data Matrix of 19 Rows and 6,070 Columns Including Features Generated From 1,080 Master Operations With Hctsa. Note. Hctsa: Highly comparative time-series analysis. Each row represents the EEG data from the subjects of the study, and each column is a feature that was normalized and reordered for better visualization. NC: Normal Control; MDI: Methamphetamine dependence individual
Not all the features extracted from hctsa are useful for classification purposes. The most useful features can be extracted by the TS_TopFeatures function in hctsa. The top 40 features utilized in our study are illustrated in Figure 2. The scatter distribution of each feature is depicted in Figure 2a with blue and red colors for the NC and MDI groups, respectively. Additionally, Figure 2b displays the median and interquarter range for each of the normalized 40 top features for NC and MDI groups.
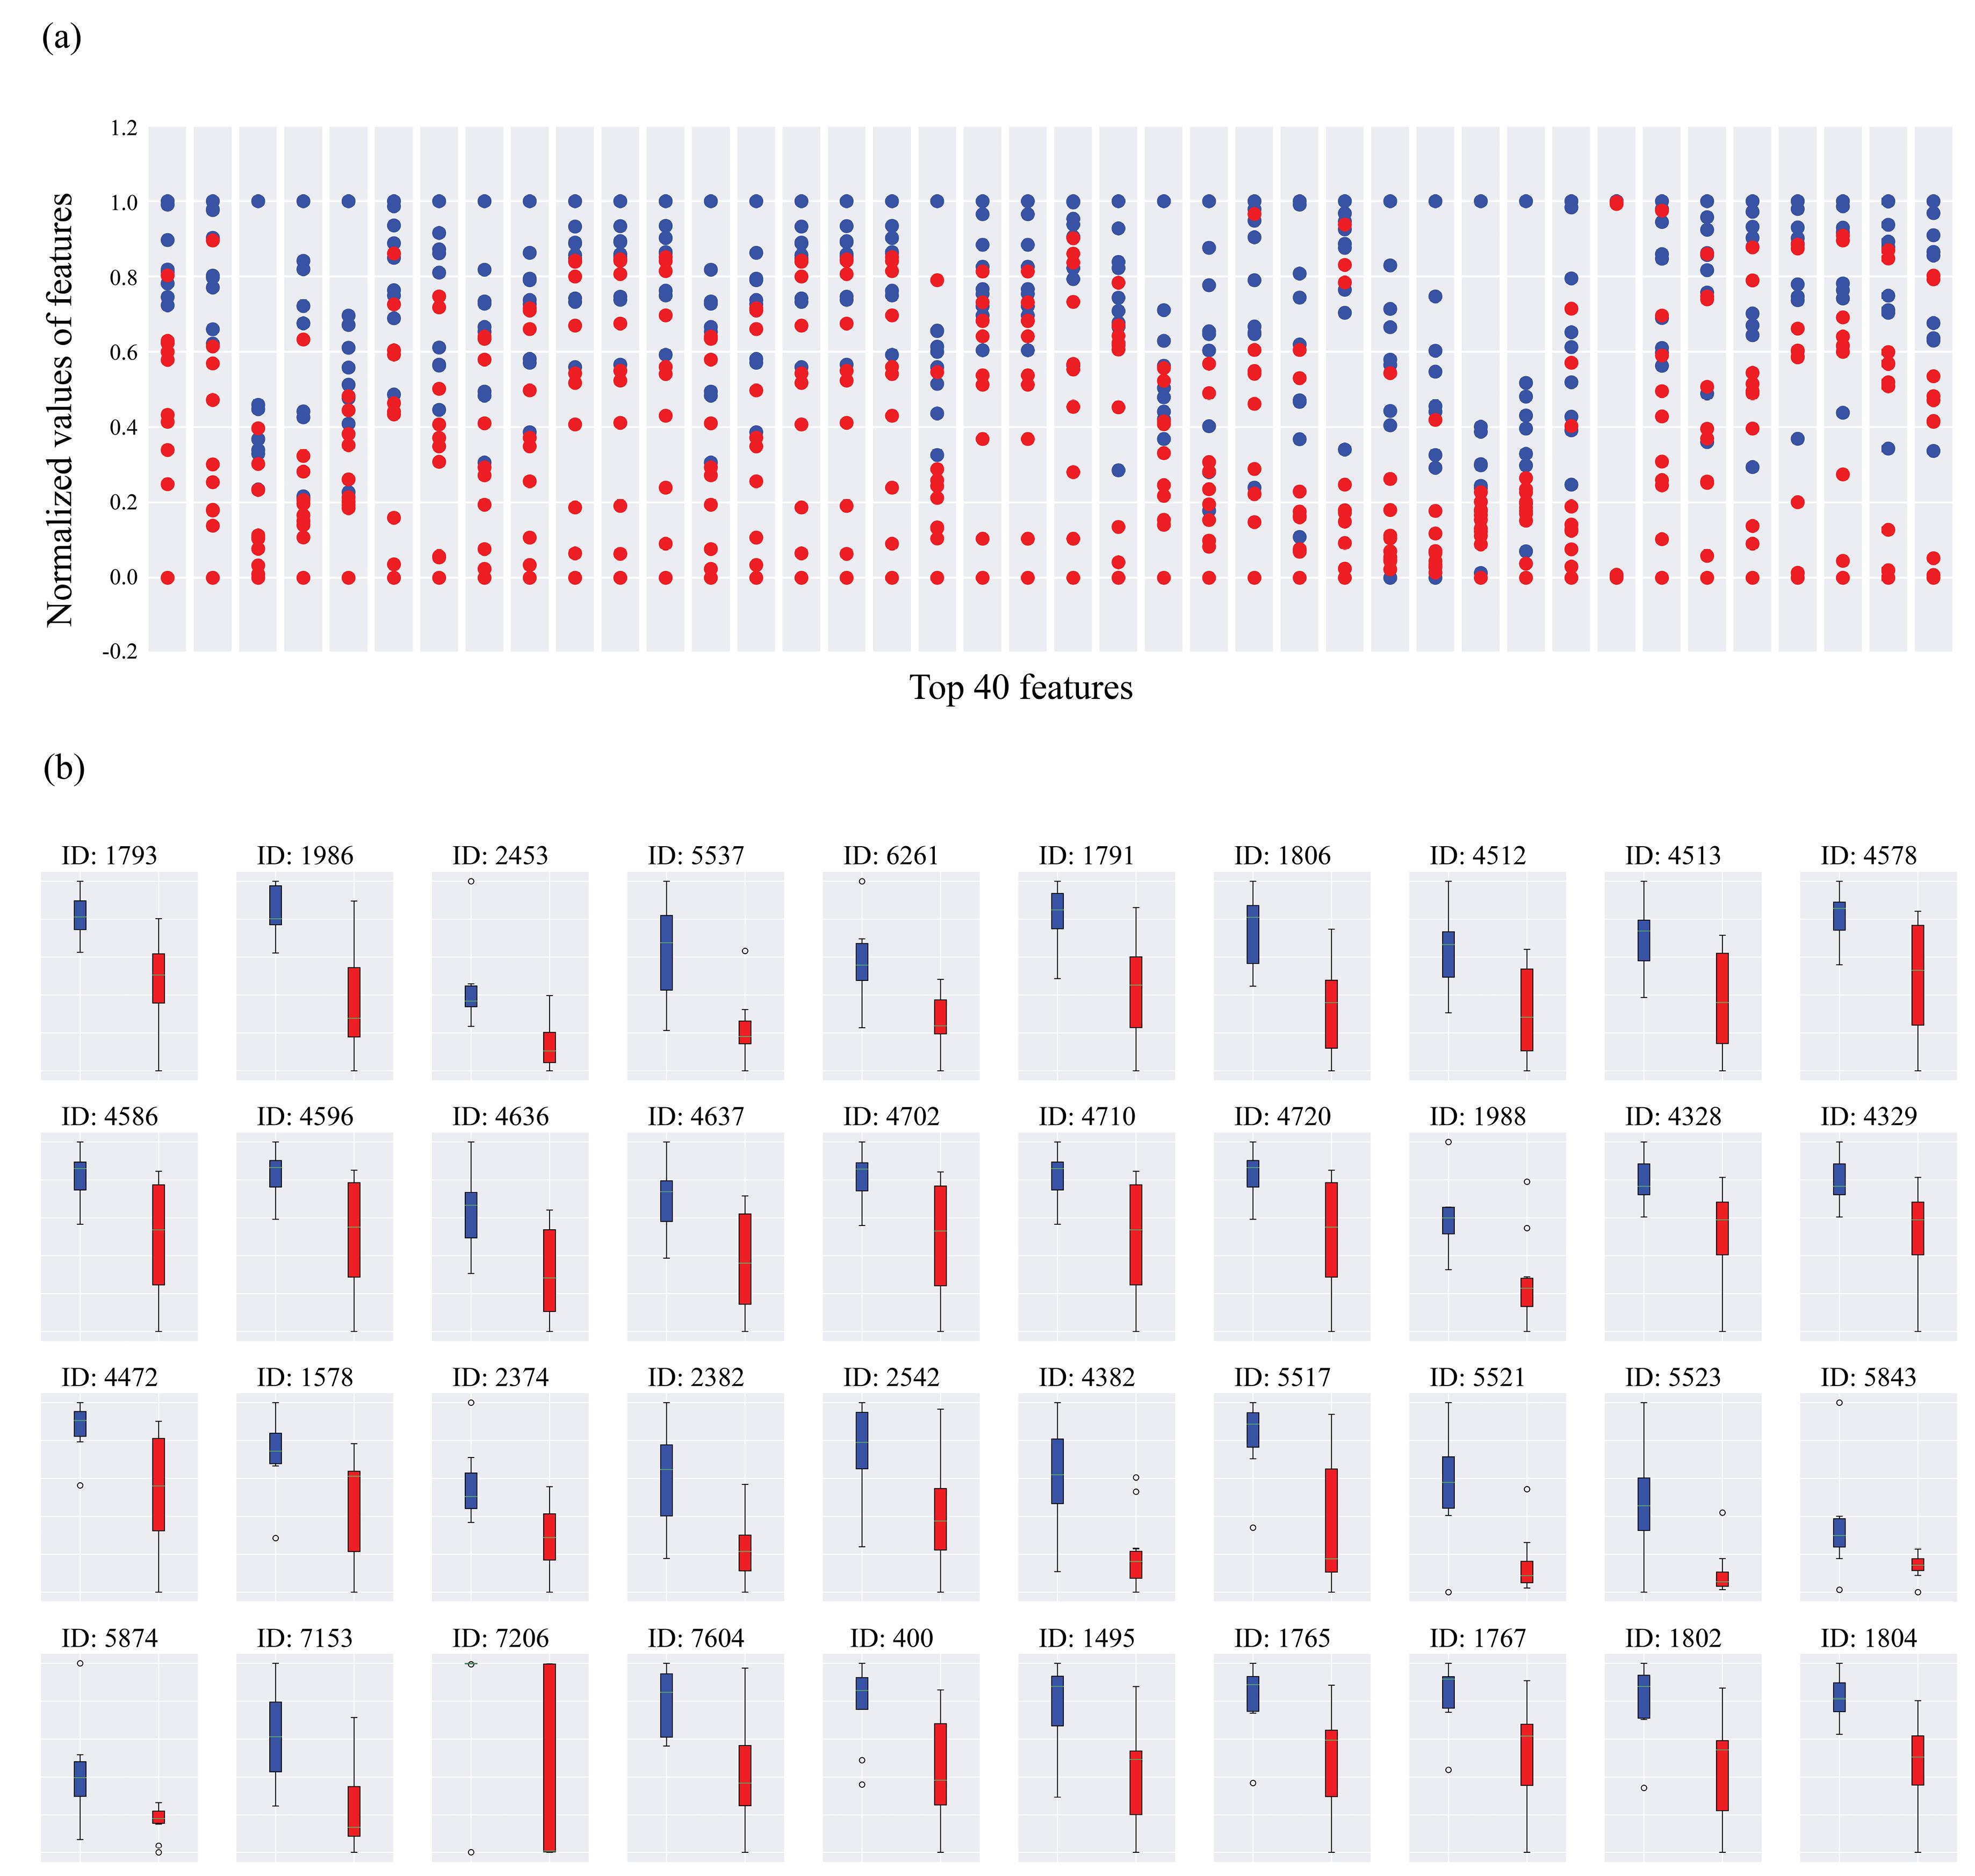
Figure 2.
Visualization List of the Top 40 Features Extracted by Hctsa. Note. (a) represents the scatter distribution of normalized values for each feature. Blue and red dots display the NC and MDI groups, respectively. (b) shows the box plot of each top 40 feature represented by their median and interquartile range. Each feature is depicted by its ID in the hctsa toolbox. NC: Normal Control; MDI: Methamphetamine-dependence individual. Hctsa: Highly comparative time-series analysis
.
Visualization List of the Top 40 Features Extracted by Hctsa. Note. (a) represents the scatter distribution of normalized values for each feature. Blue and red dots display the NC and MDI groups, respectively. (b) shows the box plot of each top 40 feature represented by their median and interquartile range. Each feature is depicted by its ID in the hctsa toolbox. NC: Normal Control; MDI: Methamphetamine-dependence individual. Hctsa: Highly comparative time-series analysis
Data Classification
Classifying the data with SVM, LR, and RF indicated that using hctsa for feature extraction resulted in high distinguishing power between the groups of the study. The Python code was employed to evaluate the accuracy of using different combinations of the top 40 features in SVM, LR, and RF classifiers. The results of our inquiry revealed that there was not any state in which a single feature could lead to an accuracy of 100% with SVM, LR, and RF classifiers. However, there were two states with combinations of two features in which using the SVM classifier could lead to an accuracy of 100%. Furthermore, using three combinations of features led to 134, 89, and 100 different states in which the accuracy was 100% in SVM, LR, and RF classifiers, respectively. Using more combinations of features results in a higher number of states in which the accuracy is 100%. The results demonstrated the number of states in which the accuracy of using various combinations for each classifier was 100% (Table 1). Considering that the computational cost for evaluating the accuracy for all combinations is extremely high, the results were computed for the combinations of selecting 1, 2, 3, 4, and all 40 features. In addition, selecting all top features for classification resulted in 100% accuracy with just the LR model. It may be worth noticing that the total number of combinations of selecting 1, 2, 3, 4, and 40 features are 40, 780, 9880, 91390, and 1, respectively.
Table 1.
Number of Ways of Reaching the Accuracy of 100 With Various Combinations of 40 Top Features
|
|
Number of Top Features
|
|
1
|
2
|
3
|
4
|
40
|
| Classifying method |
SVM |
0 |
2 |
134 |
2 933 |
0 |
| LR |
0 |
0 |
89 |
3 109 |
1 |
| RF |
0 |
0 |
100 |
589 |
0 |
Note. SVM: Support vector machine; LR: Logistic regression; RF: Random forest.
Discussion
To the best of our knowledge, this study represents the first attempt to apply the hctsa method for classifying resting-state EEG data into healthy and MDI groups. The study evaluated the efficacy of hctsa and fundamental ML classification approaches in distinguishing between healthy individuals and those with MA dependence. Three distinct ML methods were assessed, specifically SVM, RFs, and LR. The results confirmed that multiple feature combinations achieved 100% accuracy across all three methods.
Overfitting is a common challenge in ML, occurring when a model becomes overly adapted to the peculiarities of the training dataset, thus failing to recognize a generalized predictive pattern.23 To address overfitting, this study employed stratified k-fold cross-validation for accuracy assessment, ensuring that the testing dataset remained independent from the training dataset.
Numerous studies have primarily focused on individuals with addiction and implemented knowledge-based systems using EEG signals to aid human decision-making in forecasting substance dependence and generating insights for developing treatment strategies targeting substance abuse. Table 2 presents recent studies that have identified MA abuse by incorporating EEG methodology into their research framework.
Table 2.
Comparing the Results of Using Different Methods of Classifying Between Healthy and MA Addicted Individuals
|
Authors
|
feature Extraction Method
|
Classification Method
|
Accuracy (%)
|
Reference
|
| Ahmadlou et al |
Visibility graph similarity in the gamma band |
EPNN |
83 |
24
|
| Shahmohammadi et al |
Area of positive sections below the time window |
Subconscious craving-based algorithm |
80 |
6
|
| Khajehpour et al |
Clustering coefficient, node strength, pairwise weighted phase lag index |
SVM |
93 |
1
|
| Ding et al |
Power spectrum |
RF |
89 |
25
|
| SVM |
90 |
| LR |
90 |
| Chen et al |
Spectral densities before and after virtual reality |
SVM |
36 |
26
|
| LR |
64 |
| DT |
84 |
| RF |
68 |
| MLP |
72 |
| RBFN |
72 |
| AB |
68 |
| GB |
76 |
Note. EPNN: Enhanced probabilistic neural network; SVM: Support vector machine; RF: Random forest; LR: Logistic regression; DT: Decision tree; MLP: Multilayer perceptron; RBFN: Radial basis function networks; AB: Ada boost; GB: Gradian boost; MA: Methamphetamine.
Ahmadlou et al pioneered the application of resting-state EEG in distinguishing MA abusers from non-drug-using controls. Their research involved assessing individuals with a history of MA abuse, revealing significant disruptions in functional connectivity within the gamma band. These findings provided valuable insights into the neurophysiological consequences of MA abuse.24 Shahmohammadi et al employed event-related potentials to differentiate between MA abusers and control subjects. They utilized the area under the curve of windowed event-related potentials, elicited by a visual paradigm comprising both drug-related and neutral imagery. This novel approach proved to be effective, as it facilitated the differentiation between MDI and NC with an accuracy rate of 80%.6
In a more recent study, Ding et al developed RF, SVM, and LR models based on power spectrum density. These models demonstrated superior accuracy, achieving rates of 89%, 90%, and 90%, respectively.25 A further developed SVM model, augmented by an array of features such as the clustering coefficient, node strength, and the pairwise weighted phase lag index, represented a superior predictive accuracy, quantifiably reaching 93%.1 Chen et al considered virtual reality as a method of differentiation, utilizing eight distinct machine-learning techniques. Nevertheless, only the DT algorithm could produce the most accurate results, boasting a commendable accuracy rate of 84%.26
ML methodologies are also applied in the medical field to differentiate between healthy individuals and other kinds of addiction, such as alcoholism. Prior research utilizing SVM and LR classifiers demonstrated a classification accuracy ranging from 85% to 95%.27-29 Farsi et al achieved a substantial accuracy of 93% using a long short-term memory (LSTM) computational model.30 The highest accuracy in distinguishing between healthy individuals and those with alcoholism is attributed to two recent studies. Salankar et al31 employed four distinct classification methodologies, along with three features derived from second-order difference plots. Remarkably, they achieved an accuracy rate of up to 97% when implementing RF and SVM classifiers. However, the accuracy escalated to an impressive 99% when they utilized the multilayer perceptron classifier. Li and Wu32 applied advanced deep learning techniques, achieving varying levels of accuracy with four different models; they included a convolutional neural network, LSTM, bidirectional long short-term memory (Bi-LSTM), and a combined convolutional neural network + Bi-LSTM model. The respective accuracies for these models were reported as 96%, 87%, 91%, and 97%. Moreover, the researchers successfully refined their model, resulting in a significant increase in performance with an impressive accuracy rate of 99%.
The present study acknowledges several limitations that warrant consideration. Firstly, the recruitment of solely male substance users significantly restricts the generalizability of the research findings. Consequently, future research should be multi-centric and incorporate both genders to adequately address this limitation. The number of participants in our study is also limited, which must be considered in future studies. Thus, further investigation using different samples is necessary to evaluate the generalizability of these trained models.
The second limitation pertains to the study’s inability to account for instances of polydrug consumption. It is plausible that individuals engaged in polydrug use may exhibit unique EEG patterns, differentiating them from those exclusively dependent on MA. Therefore, an inclusive approach that considers polydrug users is essential for a more comprehensive understanding of the relationship between EEG patterns and substance abuse in future studies. Additionally, subsequent studies should aim to conduct a comparative analysis of EEG patterns between MDI and those dependent on other substances, such as cocaine, to determine whether the identified EEG patterns are specific to MA use.
Thirdly, this study primarily aimed to explore the feasibility of utilizing ML methodologies to differentiate between individuals who consume MA and healthy individuals based on EEG data. To enhance the applicability of these findings as markers for detecting MA cravings, it is necessary to measure craving levels and other variables such as treatment adherence. Therefore, further research is warranted. Additionally, it is possible that after a year-long period of sobriety and treatment, the MA-using group could potentially resemble the healthy control group. To obtain a more nuanced understanding of this possibility, future research should involve diverse sample groups, including untreated MA users, for instance.
Conclusion
In conclusion, this study represents a pioneering attempt to apply the hctsa method combined with ML classification approaches to distinguish between healthy individuals and those with MA dependence using resting-state EEG data. The results demonstrated promising efficacy, with multiple feature combinations achieving 100% accuracy across three ML methods. The study addressed the challenge of overfitting through stratified k-fold cross-validation, ensuring independent testing datasets. Previous studies in the field have also utilized EEG methodologies to identify MA abuse, providing valuable insights into the neurophysiological consequences of substance dependence. However, there are limitations to consider, including the need for multi-centric studies with gender diversity, the inclusion of polydrug users, and comparative analyses with other substance dependencies. Future research should explore the potential of EEG patterns as markers for MA cravings, considering variables such as treatment adherence and craving levels, and involve diverse sample groups to further enhance understanding.
Authors’ Contribution
Formal analysis: Reza Meynaghizadeh-Zargar.
Resources: Ali Reza Shafiee-Kandjani, Abdollah Barati.
Supervision: Ali Reza Shafiee-Kandjani, Saeed Sadigh-Eteghad.
Visualisation: Abdollah Barati, Sareh Kazmi.
Writing-original draft: Reza Meynaghizadeh-Zargar, Sareh Kazmi.
Writing-review & editing: Saeed Sadigh-Eteghad.
Competing Interests
The authors declare that they have no conflict of interests.
Ethical Approval
The study received approval from a Regional Ethics Committee associated with Tabriz University of Medical Sciences with the assigned code TBZMED.REC.1394.26. The patients were treated properly and no intervention was forced upon them.
References
- Khajehpour H, Mohagheghian F, Ekhtiari H, Makkiabadi B, Jafari AH, Eqlimi E. Computer-aided classifying and characterizing of methamphetamine use disorder using resting-state EEG. Cogn Neurodyn 2019; 13(6):519-30. doi: 10.1007/s11571-019-09550-z [Crossref] [ Google Scholar]
- Glasner-Edwards S, Marinelli-Casey P, Hillhouse M, Ang A, Mooney LJ, Rawson R. Depression among methamphetamine users: association with outcomes from the Methamphetamine Treatment Project at 3-year follow-up. J Nerv Ment Dis 2009; 197(4):225-31. doi: 10.1097/NMD.0b013e31819db6fe [Crossref] [ Google Scholar]
- Habibi Asgarabad M, Ruhollah Hosseini S, Salehi Yegaei P, Moradi S, Lysaker PH. Psychopathology and poor clinical insight in psychotic patients: does the diagnosis matter?. J Nerv Ment Dis 2022; 210(7):532-40. doi: 10.1097/nmd.0000000000001475 [Crossref] [ Google Scholar]
- Shafiee-Kandjani AR, Jahan A, Moghadam-Salimi M, Fakhari A, Nazari MA, Sadeghpour S. Resting-state electroencephalographic coherence in recently abstinent methamphetamine users. Int J High Risk Behav Addict 2020; 9(4):e103606. doi: 10.5812/ijhrba.103606 [Crossref] [ Google Scholar]
- Chen T, Su H, Zhong N, Tan H, Li X, Meng Y. Disrupted brain network dynamics and cognitive functions in methamphetamine use disorder: insights from EEG microstates. BMC Psychiatry 2020; 20(1):334. doi: 10.1186/s12888-020-02743-5 [Crossref] [ Google Scholar]
- Shahmohammadi F, Golesorkhi M, Riahi Kashani MM, Sangi M, Yoonessi A, Yoonessi A. Neural correlates of craving in methamphetamine abuse. Basic Clin Neurosci 2016; 7(3):221-30. doi: 10.15412/j.Bcn.03070307 [Crossref] [ Google Scholar]
- Fulcher BD, Little MA, Jones NS. Highly comparative time-series analysis: the empirical structure of time series and their methods. J R Soc Interface 2013; 10(83):20130048. doi: 10.1098/rsif.2013.0048 [Crossref] [ Google Scholar]
- Fulcher BD, Jones NS. hctsa: a computational framework for automated time-series phenotyping using massive feature extraction. Cell Syst 2017;5(5):527-31.e3. 10.1016/j.cels.2017.10.001.
- Decat N, Walter J, Koh ZH, Sribanditmongkol P, Fulcher BD, Windt JM. Beyond traditional sleep scoring: massive feature extraction and data-driven clustering of sleep time series. Sleep Med 2022; 98:39-52. doi: 10.1016/j.sleep.2022.06.013 [Crossref] [ Google Scholar]
- Khatun S, Morshed BI, Bidelman GM. A single-channel EEG-based approach to detect mild cognitive impairment via speech-evoked brain responses. IEEE Trans Neural Syst Rehabil Eng 2019; 27(5):1063-70. doi: 10.1109/tnsre.2019.2911970 [Crossref] [ Google Scholar]
- Kuatsjah E, Zhang X, Khoshnam M, Menon C. Two-channel in-ear EEG system for detection of visuomotor tracking state: a preliminary study. Med Eng Phys 2019; 68:25-34. doi: 10.1016/j.medengphy.2019.03.016 [Crossref] [ Google Scholar]
- Sidey-Gibbons JAM, Sidey-Gibbons CJ. Machine learning in medicine: a practical introduction. BMC Med Res Methodol 2019; 19(1):64. doi: 10.1186/s12874-019-0681-4 [Crossref] [ Google Scholar]
- Gemein LA, Schirrmeister RT, Chrabąszcz P, Wilson D, Boedecker J, Schulze-Bonhage A. Machine-learning-based diagnostics of EEG pathology. Neuroimage 2020; 220:117021. doi: 10.1016/j.neuroimage.2020.117021 [Crossref] [ Google Scholar]
- Jacobson NC, Weingarden H, Wilhelm S. Using digital phenotyping to accurately detect depression severity. J Nerv Ment Dis 2019; 207(10):893-6. doi: 10.1097/nmd.0000000000001042 [Crossref] [ Google Scholar]
- Jiang T, Zhu J, Hu D, Gao W, Gao F, Cao J. Early seizure detection in childhood focal epilepsy with electroencephalogram feature fusion on deep autoencoder learning and channel correlations. Multidimens Syst Signal Process 2022; 33(4):1273-93. doi: 10.1007/s11045-022-00839-7 [Crossref] [ Google Scholar]
- Thakare A, Anter AM, Abraham A. Seizure disorders recognition model from EEG signals using new probabilistic particle swarm optimizer and sequential differential evolution. Multidimens Syst Signal Process 2023; 34(2):397-421. doi: 10.1007/s11045-023-00870-2 [Crossref] [ Google Scholar]
- Hudon A, Dellazizzo L, Phraxayavong K, Potvin S, Dumais A. Association between cannabis and violence in community-dwelling patients with severe mental disorders: a cross-sectional study using machine learning. J Nerv Ment Dis 2023; 211(2):88-94. doi: 10.1097/nmd.0000000000001604 [Crossref] [ Google Scholar]
- Fang Y, Rong R, Huang J. Hierarchical fusion of visual and physiological signals for emotion recognition. Multidimens Syst Signal Process 2021; 32(4):1103-21. doi: 10.1007/s11045-021-00774-z [Crossref] [ Google Scholar]
- Yalamanchili B, Samayamantula SK, Anne KR. Neural network-based blended ensemble learning for speech emotion recognition. Multidimens Syst Signal Process 2022; 33(4):1323-48. doi: 10.1007/s11045-022-00845-9 [Crossref] [ Google Scholar]
- Asgharzadeh Alvar A, Deevband MR, Ashtiyani M. Neutron spectrum unfolding using radial basis function neural networks. Appl Radiat Isot 2017; 129:35-41. doi: 10.1016/j.apradiso.2017.07.048 [Crossref] [ Google Scholar]
- Hosmer DW Jr, Lemeshow S, Sturdivant RX. Applied Logistic Regression. John Wiley & Sons; 2013.
- Breiman L. Random forests. Mach Learn 2001; 45(1):5-32. [ Google Scholar]
- Dietterich T. Overfitting and undercomputing in machine learning. ACM Comput Surv 1995; 27(3):326-7. [ Google Scholar]
- Ahmadlou M, Ahmadi K, Rezazade M, Azad-Marzabadi E. Global organization of functional brain connectivity in methamphetamine abusers. Clin Neurophysiol 2013; 124(6):1122-31. doi: 10.1016/j.clinph.2012.12.003 [Crossref] [ Google Scholar]
- Ding X, Li Y, Li D, Li L, Liu X. Using machine-learning approach to distinguish patients with methamphetamine dependence from healthy subjects in a virtual reality environment. Brain Behav 2020; 10(11):e01814. doi: 10.1002/brb3.1814 [Crossref] [ Google Scholar]
- Chen CC, Tsai MC, Wu EH, Chung CR, Lee Y, Chiu PR. Neuronal Abnormalities Induced by an Intelligent Virtual Reality System for Methamphetamine Use Disorder. IEEE J Biomed Health Inform 2022; 26(7):3458-65. doi: 10.1109/jbhi.2022.3154759 [Crossref] [ Google Scholar]
- Bae Y, Yoo BW, Lee JC, Kim HC. Automated network analysis to measure brain effective connectivity estimated from EEG data of patients with alcoholism. Physiol Meas 2017; 38(5):759-73. doi: 10.1088/1361-6579/aa6b4c [Crossref] [ Google Scholar]
- Mumtaz W, Vuong PL, Xia L, Malik AS, Rashid RB. An EEG-based machine learning method to screen alcohol use disorder. Cogn Neurodyn 2017; 11(2):161-71. doi: 10.1007/s11571-016-9416-y [Crossref] [ Google Scholar]
- Mumtaz W, Saad M, Kamel N, Ali SS, Malik AS. An EEG-based functional connectivity measure for automatic detection of alcohol use disorder. Artif Intell Med 2018; 84:79-89. doi: 10.1016/j.artmed.2017.11.002 [Crossref] [ Google Scholar]
- Farsi L, Siuly S, Kabir E, Wang H. Classification of alcoholic EEG signals using a deep learning method. IEEE Sens J 2020; 21(3):3552-60. doi: 10.1109/jsen.2020.3026830 [Crossref] [ Google Scholar]
- Salankar N, Qaisar SM, Pławiak P, Tadeusiewicz R, Hammad M. EEG based alcoholism detection by oscillatory modes decomposition second order difference plots and machine learning. Biocybern Biomed Eng 2022; 42(1):173-86. doi: 10.1016/j.bbe.2021.12.009 [Crossref] [ Google Scholar]
- Li H, Wu L. EEG classification of normal and alcoholic by deep learning. Brain Sci 2022; 12(6):778. doi: 10.3390/brainsci12060778 [Crossref] [ Google Scholar]